How to Calculate Monthly Recurring Revenue (MRR) Sat, Apr 30, 2016

What is MRR and How calculate it?
Before we start, let’s define MRR. Zuora defines MRR as bellow;
Monthly recurring revenue (MRR) is a dollar amount derived from a company’s total annual recurring revenue (ARR), normalized to a monthly value. In its simplest form, MRR is the money paid monthly for a subscription to a product or service. Properly used, it can provide valuable, unique insight into sales and cash flow dynamics.
In order to understand it better, let’s look at the following example;
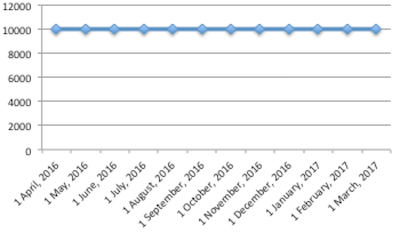
A new $120,000 annual contract starts on April 1, 2016 and ends on April 1, 2017. The question is How much Monthly Recurring Revenue was added and when?
The answer to this question is simple, $10,000 in April 2016, specifically April 1, 2016. In other word; if no one else subscribe, the MRR form April 2016 till 2017 is $10,000.
According to the example, we need 3 parameters to be able to calculate the MRR;
- Subscription start date
- Subscription end date
- Value you are gonna get every day of month (I like to call it daily MRR but we can call it Monthly Recurring Charge MRC as well)
MRR Calculation
calculating MRR for one subscription is clear but what about real world example, in which we have thousands or millions of records. I break the process into two simple steps;
1. Calculate total MRC for each day
For instance, if you want to generate report form 1 Jan 2015 till 30 Dec 2015, we need to calculate (TMRC) total sum of MRC for every
day of the year.
| date | TMRC |
|---|---|
| 01 Jan 2015 | $180 |
| 02 Jan 2015 | $240 |
| 03 Jan 2015 | $590 |
| … | … |
| … | … |
| 27 Dec 2015 | $2080 |
| 28 Dec 2015 | $620 |
| 29 Dec 2015 | $900 |
| 30 Dec 2015 | $120 |
| 31 Dec 2015 | $780 |
TMRC of nDate is equal to sum of all MRCs of subscriptions which are active and they started in the same day of nDate
2. Generate the report
Based on data prepared in step 1, we can generate two important reports;
- Monthly Recurring Revenue which is equal to sum of all TMRC in one month.
- Rolling Monthly Recurring Revenue which is equal to sum of all TMRC of last 30 days.
Case study
I generate 16137 sample subscription records which you can download from here. And you can find the Ipython notebook of following codes here.
Let’s start to generate the reports with pandas and matplotlib.
Load required libraries
    import csv
    import pandas as pd
    import numpy as np
    from datetime import timedelta, date
    %matplotlib inline
    import matplotlib
    import matplotlib.pyplot as plt
Data Preprocessing
    # loading data
    df = pd.read_csv('sample-subscription.csv')
    report_start_date = date(2015,1,1)
    report_end_date = date(2015,12,1)

    # Data preprocessing
    df.fillna(report_end_date, inplace=True)
    df['subscription_start_date'] =pd.to_datetime(df['subscription_start_date'], format = '%Y-%m-%d')
    df['subscription_end_date'] =pd.to_datetime(df['subscription_end_date'], format = '%Y-%m-%d')
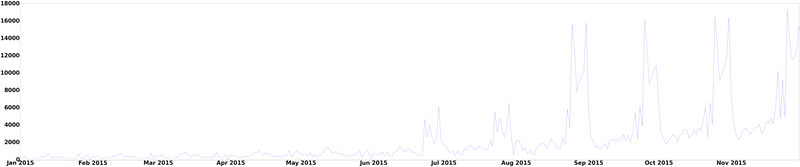
Calculate TMRC for each day
    # Helper function
    def daterange(start_date, end_date):
        for n in range(int ((end_date - start_date).days)):
            yield start_date + timedelta(n)

    # calculate tmrc for every day
    daily_mrr=[]
    for my_date in daterange(report_start_date, report_end_date):
        my_date_df = df[(df['subscription_end_date']>=my_date )
                        & (df['subscription_start_date']<= my_date)
                        & (df['subscription_start_date'].apply(lambda x: x.day) == my_date.day)]
        tmrc = my_date_df['dmrc'].sum()
        daily_mrr.append({'date':my_date,'mrc':tmrc})

    # Visualization
    dates = matplotlib.dates.date2num([x['date'] for x in daily_mrr])
    y = [x['mrc'] for x in daily_mrr]
    plt.figure(figsize=(100,20))
    plt.plot_date(dates, y,'-')
    plt.rc('font',**{'family' : 'normal',
            'weight' : 'bold',
            'size'   : 40})
    plt.show()
Generate Reports
since we have our daily MRR data, we can group it by Monthly or Weekly.
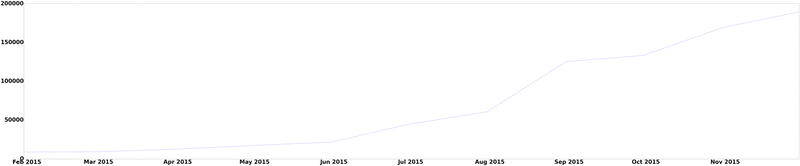
Monthly MRR
    df = pd.DataFrame(daily_mrr)
    df = df.set_index(pd.DatetimeIndex(df['date']))
    # group by dataframe Monthly
    g_df= df.groupby(pd.TimeGrouper("m"))
    res = g_df.sum()
    res.sort_index()
    res['date']=res.index.to_datetime()
    dates = matplotlib.dates.date2num(res.index.to_pydatetime())
    y = res['mrc']
    plt.figure(figsize=(100,20))
    plt.plot_date(dates, y,'-')
    plt.rc('font',**{'family' : 'normal',
            'weight' : 'bold',
            'size'   : 40})
    plt.show()
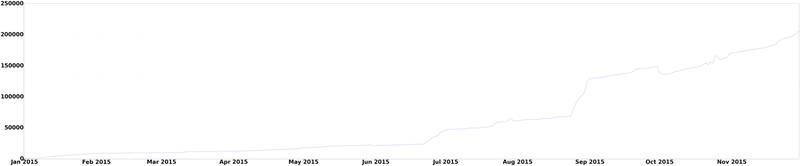
Rolling MRR
As mentioned earlier, rolling MRR for each day is sum of daily MRR of past 30 days.
    rolling_mrr = [{
                'date': x['date'],
                'mrc': x['mrc'] + sum([z['mrc'] for z in daily_mrr
                                       [0 if daily_mrr.index(x) < 30
                                        else
                                        daily_mrr.index(x) - 30:daily_mrr.index(x)]])} for x in daily_mrr]

    # visualization
    dates = matplotlib.dates.date2num([x['date'] for x in rolling_mrr])
    y = [x['mrc'] for x in rolling_mrr]
    plt.figure(figsize=(100,20))
    plt.plot_date(dates, y,'-')
    plt.rc('font',**{'family' : 'normal',
            'weight' : 'bold',
            'size'   : 40})
    plt.show()